
A Step-by-Step Guide to Creating Clinical Reports from Spirometry Test Results:
- Matron

- Nov 26, 2024
- 5 min read

Spirometry results can be a goldmine of information when interpreted carefully, but turning that data into a clear, concise clinical report can sometimes feel daunting.
In this guide, I’ll share the exact steps I use to create clinical reports from spirometry test results.
However, it’s important to stress that this is simply my way of approaching the process. It works for me, but every clinician has their own preferences and methods that align with their experience and practice setting.
Take what resonates, adapt what doesn’t, and remember that the ultimate goal is to ensure clarity and accuracy in your reports.
STEP 1
Start with the FEV1/FVC Ratio:
The first thing I always do when reviewing spirometry results is to look at the FEV1/FVC ratio.
This is a crucial starting point because if the ratio is below the lower limit of normal (LLN) for the patient, it indicates the presence of airflow obstruction.
The LLN accounts for age, sex, height, and ethnicity, making it a more accurate threshold than a fixed ratio for determining abnormalities.
Starting here sets the foundation for interpreting the rest of the results, as it points to whether we are dealing with obstructive lung disease or not.
Using the data below as an example...
The LLN for the FEV/FVC ratio is 0.62, or 62% depending on how your machine is set up to display data.

Once I have established the LLN for the FEV/FVC ratio I then compare it to the patients actual FEV/FVC ratio.
The table below uses the term 'measured' when it references patient specific data. Other machines use terms such as 'base' or 'baseline' but in my head I think of it as ACTUAL patient data.
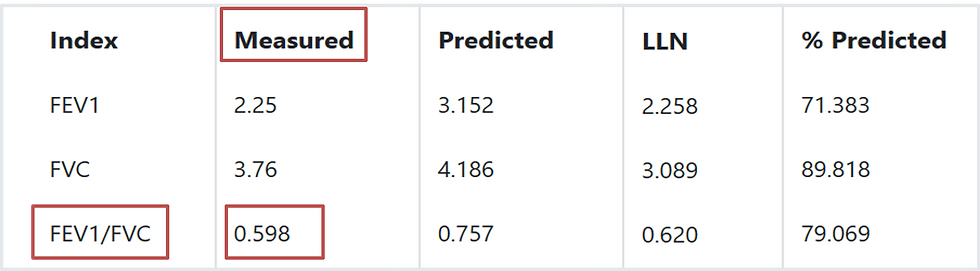
So, if you look at the measured (actual) FEV/FVC ratio for this patient it is 0.59, or 59% depending on how your machine is set up to display data.
As the actual FEV/FVC ratio is less than the LLN, this indicates the presence of airflow obstruction.
This doesn't tell us what is causing the airflow obstruction, just that it is present.
STEP 2
Assess the FVC for Evidence of Restriction:
After evaluating the FEV1/FVC ratio, the next step is to assess the forced vital capacity (FVC) to check for any indication of a potential restrictive defect.
Restrictive lung disease differs fundamentally from obstructive lung disease.
While obstruction prevents air from leaving the lungs, restriction occurs when something limits the lungs from filling with air in the first place.
In general practice, it’s important to recognize that we can only suspect restrictive lung disease we cannot definitively diagnose it.
To investigate the possibility of restriction, I compare the patient’s actual FVC to the lower limit of normal (LLN) for their demographic. If the actual FVC is above the LLN, it does not support the presence of a restrictive defect. However, if the FVC is below the LLN, further investigation is warranted to confirm whether restriction is present.
It’s also important to note that an isolated reduction in FVC is not enough to diagnose a restrictive defect. Confirmation typically requires lung volume measurements, such as total lung capacity (TLC), to determine if restriction is truly present. This additional testing is beyond the scope of general practice but should be considered as part of a referral to specialist respiratory services.
By systematically evaluating the FVC alongside the FEV1/FVC ratio, we can better understand the patient’s lung function and identify cases requiring further investigation or specialist input.
Going back to our example...

In this scenario, the FVC falls within an acceptable range for the patient’s demographic parameters, suggesting that there is no evidence to support restriction.
STEP 3
Determine the Severity of Airflow Obstruction Using FEV1:
With coexisting restriction effectively ruled out, the next step is to assess the FEV1 to determine the severity of the airflow obstruction.
Up to this point, we’ve relied on the patient’s actual measurements and their lower limit of normal (LLN) to guide our report.
However, when evaluating the severity of obstruction, we shift our focus to the percent predicted value for FEV1.
The percent predicted provides a comparison of the patient’s measured FEV1 to the expected value for someone of their age, sex, height, and ethnicity.
This allows us to classify the degree of obstruction and understand how significantly the patient’s lung function deviates from normal.
The final piece of the puzzle...
With coexisting restriction effectively ruled out, the next step is to assess the FEV1 to determine the severity of airflow obstruction. So far, we’ve relied on the patient’s actual measurements and their lower limit of normal (LLN) to guide our interpretation.
However, when classifying the severity of obstruction, we turn to the percent predicted value for FEV1. The percent predicted compares the patient’s measured FEV1 to the expected value for someone of the same age, sex, height, and ethnicity. This approach has long been the standard for assessing severity in primary care, offering a simple and practical method for reporting spirometry results.
Here is the commonly used grading system for airflow obstruction based on percent predicted FEV1:
Mild obstruction: FEV1 ≥ 80% predicted
Moderate obstruction: FEV1 50–79% predicted
Severe obstruction: FEV1 30–49% predicted
Very severe obstruction: FEV1 < 30% predicted

In this case study, the patient’s actual FEV1 is 2.25 litres, which corresponds to 71% of their predicted value. Based on the grading system outlined earlier, an FEV1 percent predicted value between 50% and 79% indicates moderate airflow obstruction. Since 71% falls within this range, we can classify the patient’s airflow obstruction as moderate.
FINAL CLINICAL REPORT
The spirometry test data suggests that the patient has moderate airflow obstruction
But it doesn't tell us what is causing the obstruction
This is where interpretation comes in and interpretation requires clinical expertise and, more often than not, information obtained from additional tests such as exhaled nitric oxide testing and bronchodilator reversibility testing
Percent Predicted FEV1: A Word of Caution
It’s important to acknowledge that the use of percent predicted is not without its limitations.
There is growing recognition of the value of using z-scores instead of percent predicted for assessing lung function.
Z-scores provide a more standardized way of expressing deviations from normal by accounting for variability within a population. While this shift represents a step forward in accuracy, it is not yet a requirement in primary care settings. Current primary care-specific guidelines continue to endorse the use of percent predicted, so there’s no need to worry about adopting z-scores at this time.
For the purposes of this blog, we’ll stick to percent predicted as the method for assessing severity.
If you’re curious to learn more about z-scores and their potential applications, keep an eye out for a future blog post where I’ll explore this topic in detail.
By focusing on percent predicted in this step, we can classify the severity of airflow obstruction in a way that aligns with current primary care practices while keeping the process straightforward and practical.


Comments